
File:XYZ-DIS magnetic field coordinates.svg

Dimensioni di questa anteprima PNG per questo file SVG: 512 × 175 pixel. Altre risoluzioni: 320 × 109 pixel | 640 × 219 pixel | 1 024 × 350 pixel | 1 280 × 438 pixel | 2 560 × 875 pixel.
File originale (file in formato SVG, dimensioni nominali 512 × 175 pixel, dimensione del file: 8 KB)
Se non hai mai usato Commons, visita la pagina di benvenuto, o leggi le FAQ.
Visualizza quali progetti usano questa immagine.
Dettagli
| Descrizione |
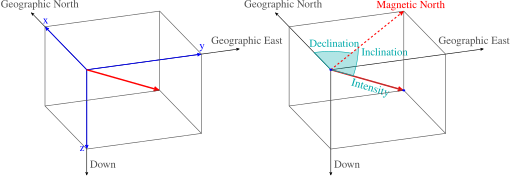
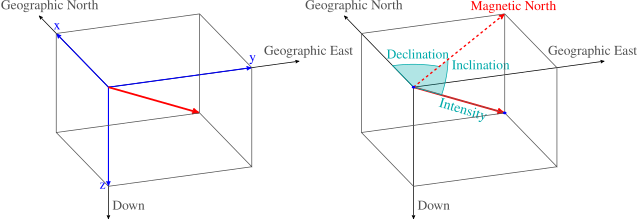
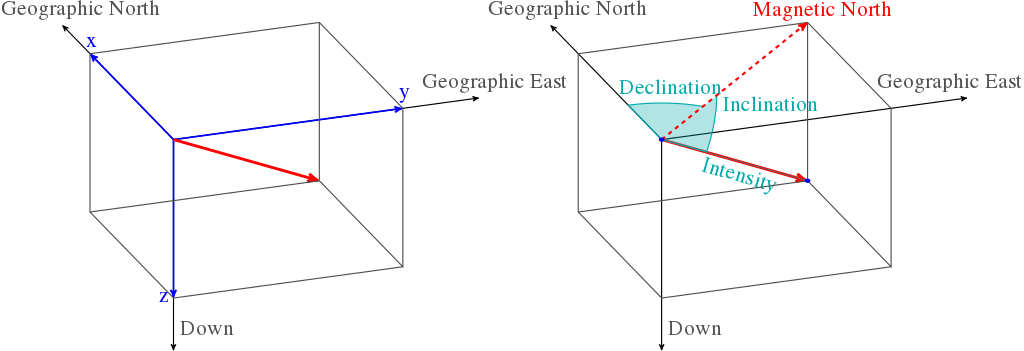
English: The graphic serves to represent the analogy of the XYZ and the more commonly used DIS coordinate systems. Blue indicated the coordinates in the two different systems, while red indicates the resultant magnetic field. |
| Data | |
| Fonte |
Opera propria |
| Autore |
Chymæra Recreated in LaTeX by: Rubber Duck (☮ • ✍) |
| SVG sviluppo | Questa grafica vettoriale è stata creata con LaTeX da Rubber Duck (☮ • ✍) and converted to SVG using dvisvgm and manually edited. |
| Codice sorgente | SVG code\documentclass[12pt,border=0pt,tikz,class=scrartcl,multi=false]{standalone}
\usepackage{times}
\usepackage{pgfplots}
\pgfplotsset{compat=1.10}
\usetikzlibrary{arrows,decorations.text}
\usepackage{tikz-3dplot}
\pagestyle{empty}
\begin{document}
\def\LA{2}
\def\Lb{1.5}
\def\gap{1.5cm}
\tdplotsetmaincoords {-60}{70}
\begin{tikzpicture}[thick,auto,>=stealth',xscale=4,yscale=3,tdplot_main_coords]
\begin{scope} [xshift=-\gap]
\draw [->] (0,0,0) -- (-\LA,0,0) node [anchor=south,gray] {Geographic North};
\draw [->] (0,0,0) -- (0,\LA,0) node [anchor=south,gray] {Geographic East};
\draw [->] (0,0,0) -- (0,0,\LA) node [pos=.9,right,gray] {Down};
\draw [->,blue,very thick] (0,0,0) -- (-\Lb,0,0) node [anchor=south] {x};
\draw [->,blue,very thick] (0,0,0) -- (0,\Lb,0) node [anchor=south] {y};
\draw [->,blue,very thick] (0,0,0) -- (0,0,\Lb) node [left] {z};
\draw [->,red,line width=2pt] (0,0,0) -- (-\Lb,\Lb,\Lb);
\draw [gray] (-\Lb,0,0) -- ++(0,\Lb,0) -- ++(\Lb,0,0)
-- ++(0,0,\Lb) -- ++(-\Lb,0,0) -- ++(0,0,-\Lb)
(-\Lb,0,0) -- ++(0,0,\Lb) -- ++(\Lb,0,0) -- ++(0,\Lb,0)
(-\Lb,0,\Lb) -- ++(0,\Lb,0)
;
\end{scope}
\begin{scope} [xshift=\gap]
\draw [->] (0,0,0) -- (-\LA,0,0) node [anchor=south,gray] {Geographic North};
\draw [->] (0,0,0) -- (0,\LA,0) node [anchor=south,gray] {Geographic East};
\draw [->] (0,0,0) -- (0,0,\LA) node [pos=.9,right,gray] {Down};
\draw [->,red,line width=2pt] (0,0,0) -- (-\Lb,\Lb,\Lb);
\draw [thin,cyan,postaction={decoration={text along path,
raise=-10pt,text color=cyan,text align={center},
text={Intensity} },decorate}]
(0,0,0) -- (-\Lb,\Lb,\Lb);
\tdplotsetthetaplanecoords{135};
%\tdplotdrawarc [tdplot_rotated_coords,cyan] {(0,0,0)} {.8} {55}{90}{above right=5pt and 0pt}{Inclination};
\draw [tdplot_rotated_coords,fill=cyan,fill opacity=.3,cyan] (0,.8,0)
arc (90:55:.8) node [pos=.1,right,opacity=1] {Inclination}
-- (0,0,0);
%\tdplotdrawarc [cyan,fill=cyan] {(0,0,0)} {.6} {180}{135}{above}{Declination};
\draw [cyan,fill=cyan,fill opacity=.3] (0,0,0) -- (-.6,0,0)
arc (180:135:.6) node [above,pos=.5,opacity=1] {Declination};
\draw [gray] (-\Lb,0,0) -- ++(0,\Lb,0) -- ++(\Lb,0,0)
-- ++(0,0,\Lb) -- ++(-\Lb,0,0) -- ++(0,0,-\Lb)
(-\Lb,0,0) -- ++(0,0,\Lb) -- ++(\Lb,0,0) -- ++(0,\Lb,0)
(-\Lb,0,\Lb) -- ++(0,\Lb,0)
;
\draw [->,red,dashed, line width=1.5pt] (0,0,0) -- (-\Lb,\Lb,0) node [anchor=south] {Magnetic North};
\draw [fill=blue,draw=none] (0,0,0) circle (.5pt) (-\Lb,\Lb,\Lb) circle (.5pt);
\end{scope}
\end{tikzpicture}
\end{document}
|

|
Questo file SVG contiene del testo che può essere facilmente tradotto nella tua lingua, utilizzando un editor che supporta SVG (ad esempio un editor XML o di testo). Per maggiori informazioni vedi: Tradurre un file SVG. |
Licenza
Io, detentore del copyright su quest'opera, dichiaro di pubblicarla con la seguente licenza:
Questo file è disponibile in base alla licenza Creative Commons Attribuzione-Condividi allo stesso modo 3.0 Unported
- Tu sei libero:
- di condividere – di copiare, distribuire e trasmettere quest'opera
- di modificare – di adattare l'opera
- Alle seguenti condizioni:
- attribuzione – Devi fornire i crediti appropriati, un collegamento alla licenza e indicare se sono state apportate modifiche. Puoi farlo in qualsiasi modo ragionevole, ma non in alcun modo che suggerisca che il licenziante approvi te o il tuo uso.
- condividi allo stesso modo – Se remixi, trasformi o sviluppi il materiale, devi distribuire i tuoi contributi in base alla stessa licenza o compatibile all'originale.
Cronologia del file
Fare clic su un gruppo data/ora per vedere il file come si presentava nel momento indicato.
| Data/Ora | Miniatura | Dimensioni | Utente | Commento | |
|---|---|---|---|---|---|
| attuale | 21:26, 22 apr 2015 | 512 × 175 (8 KB) | Krishnavedala | increased font size and more optimized | |
| 21:17, 22 apr 2015 | 892 × 306 (8 KB) | Krishnavedala | Better drawing with bigger and legible translatable fonts. | ||
| 04:17, 8 giu 2012 |  | 644 × 266 (27 KB) | Chymæra | font issues | |
| 03:58, 8 giu 2012 |  | 644 × 266 (29 KB) | Chymæra | {{subst:Upload marker added by en.wp UW}} {{Information |Description = {{en|The graphic serves to represent the analogy of the XYZ and the more commonly used DIS coordinate systems. Blue indicated the coordinates in the two different systems, while red... |
Utilizzo del file
La seguente pagina usa questo file:
Utilizzo globale del file
Anche i seguenti wiki usano questo file:
- Usato nelle seguenti pagine di ast.wikipedia.org:
- Usato nelle seguenti pagine di bn.wikipedia.org:
- Usato nelle seguenti pagine di ca.wikipedia.org:
- Usato nelle seguenti pagine di en.wikipedia.org:
- Usato nelle seguenti pagine di es.wikipedia.org:
- Usato nelle seguenti pagine di hi.wikipedia.org:
- Usato nelle seguenti pagine di it.wikibooks.org:
- Usato nelle seguenti pagine di or.wikipedia.org:
- Usato nelle seguenti pagine di pt.wikipedia.org:
- Usato nelle seguenti pagine di tr.wikipedia.org:
- Usato nelle seguenti pagine di vi.wikipedia.org: